METHOD:FROMPASSPORTTOGREENFRAMEWORK
Five steps that turn biophilic urbanism from a description into an executable programme.
The Biophilic Cities section describes what a city ought to be. That is not enough: a description does not build anything. But the opposite extreme fails too — a composite “biophilia index” published before the data has been gathered destroys trust faster than having no index at all: it rests on hand-picked weights, and the first question, “where does the number come from”, is enough to sink it. The method below is built so that each step rests on the previous one and every quantity carries a source and a date. It is deliberately dull: first establish what exists, and only at the end what it costs.
Five steps
The order is not decorative. A framework drawn before the data layers is a picture; a portfolio assembled before the framework is a wish list; an indicator assigned before the portfolio is a promise nobody is accountable for.
01Territory passport — what exists
Boundaries, population and its trend, housing stock, public facilities, transport links, administrative status and — above all — who controls what. The passport does not assess, it records. Unknown quantities are marked as unknown rather than filled in with something plausible.
02Data layers — what can be computed
Spatial layers are laid over the passport: buildings and courtyards, the pedestrian and road network, green and water features, barriers (arterial road, railway, industrial site, fence), land surface temperature and vegetation index. Some layers can be computed today without anyone's permission; others exist only inside an agency.
03Green framework — what ought to exist
A framework is not the sum of the parks but a connected system: large natural areas, the corridors joining them, district centres, local squares, courtyards and the routes to school and station. It is designed from the breaks: first find where connectivity fails — a crossing over the highway, a dead end at the tracks, an industrial fence — and build the framework there, rather than wherever planting happens to be convenient.
04Project portfolio — what to do
The framework is broken into a finite number of projects, each with an address, a landowner, a cost, a deadline and a responsible party. A project with no answer to “whose land is this and who pays” does not enter the portfolio — it stays on the list of unresolved questions. This cuts out most of the attractive proposals and leaves the executable ones.
05Verification — how to prove it got better
The indicator “N trees planted” means nothing: a hundred thousand trees planted in the wrong places make a city worse while allowing a report of improvement. What must be counted is function: how many residents gained access, how much shade area grew, how far surface temperature fell, how many kilometres of framework became connected. All of these can be checked independently of the contractor.
What open data can compute, and what it cannot
This is the central distinction of the whole method. The two columns must not be mixed: the moment computed and requested figures are presented as one list, the reader stops trusting either.
Computable today
Access to nature: the share of residents within a 300-metre walk of a green area — along the street network, not as a straight line on the map.
Framework connectivity: where green areas are joined by a walkable route, and where they are severed by an arterial road, railway tracks or a fence.
Canopy cover and the heat island: from satellite imagery — vegetation index and land surface temperature, always with the acquisition date.
Barriers: railway tracks, arterial roads, industrial sites — whatever keeps the adjacent forest out of reach.
Requires a request
Species composition, age, diameter and condition of plantings — available only from a municipal inventory.
Which body holds each plot on its balance sheet, and the actual cost of maintaining it.
Development and comprehensive-redevelopment plans not yet released publicly.
Stormwater drainage: where it runs, where it discharges and what overflows in heavy rain.
The split is deliberate. Everything on the left is computed without anyone's permission and can be re-checked by any reader from the same sources. Everything on the right requires a formal request — and until it is answered it stays a blank line, not an expert estimate.
Indicators someone is accountable for
The 3-30-300 rule sets the frame, but it has to enter a programme as quantities somebody commits to change by a stated date. On the left are the customary formulations, which commit to nothing; on the right, the same intentions worded so that failure is visible.
Plant 5,000 trees
Raise the share of residents living within a 300-metre walk of a green area from the measured baseline to 90% by a stated year
Landscape the square
Connect the forest to the residential blocks by a continuous walking route, via a crossing that does not exist today
Increase the area of green space
Raise canopy cover in the block to 30% — measured on a summer image, not in the design documents
Reduce the heat load on the built-up area
Cut mean surface temperature of the block at July midday by 2 °C against the baseline-year measurement
Create green routes to schools
Raise to 80% the share of schoolchildren whose route to school runs mostly along a planted corridor and crosses no arterial road at grade
What the method rests on
The method requires no new law, and that is its political advantage: it offers not a parallel reality but a way to execute what has already been adopted.
The citation details of these acts were verified against their texts in legal reference databases in August 2026.
Where application begins
The method is worked through on one territory in full, rather than across many at once and shallowly. The first territory is chosen on three criteria, and all three are about verifiability rather than convenience.
A tractable scale
The calculation can be carried through to the end and re-checked, and a mistake does not cost too much. A territory you cannot walk in full is not suitable for a first application.
A known counterparty
It must be clear whom to address a request for the closed data to, and with whom to sign off the result. Without that, the right-hand data column stays empty for good.
A passport already assembled
Step one must be done before anything else. Until there is a document where every figure carries a source, there is nothing for the layers to be laid over.
What the method does not do
Listed here rather than in a footnote, because a method without stated limits is not a method but a sales pitch.
It does not replace fieldwork. An image shows that a canopy is there; it does not show that the tree is diseased and its root system was destroyed when utilities were laid.
It gives no composite score until the data is in. A single figure of so-many-out-of-a-hundred comes last, not first — otherwise it rests on hand-picked weights.
It does not resolve the land question. If a plot is privately owned or reserved for development, the method will show that but will not remove it.
It does not scale before it has been worked through on one territory. The second case is taken up after the first, not alongside it.
Why this is needed
The difference between an environmental project and a territorial development programme is not rhetorical: it is whether, at the end, you can say what specifically changed and by how much. The method exists precisely so that such an answer is possible and does not depend on who carried out the works.
The method answers four questions in order: what exists, what ought to exist, what must be done to get there, and how to prove it got better. Skip any of the first three and the fourth becomes a report.
What the framework is made of
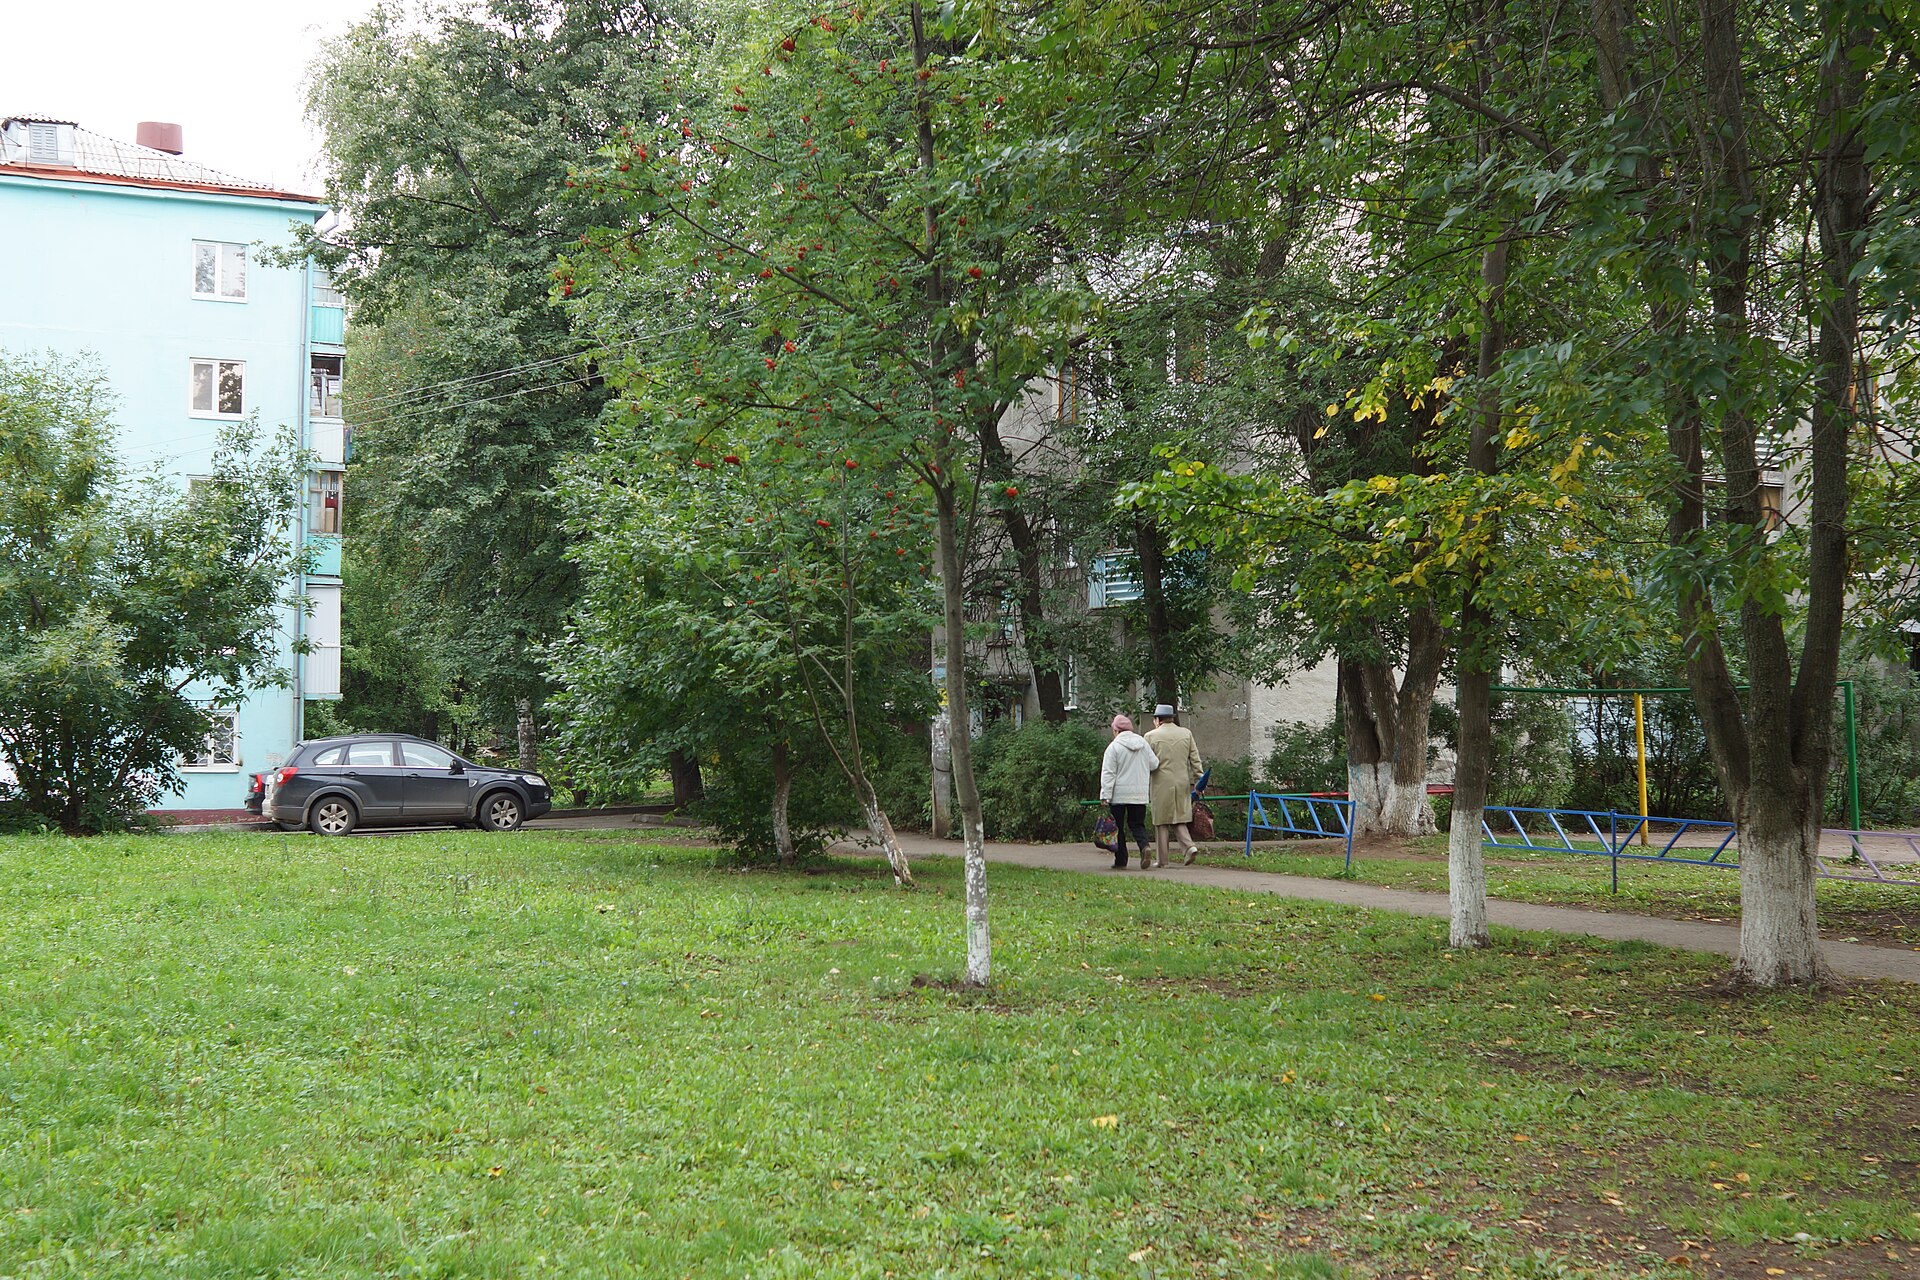
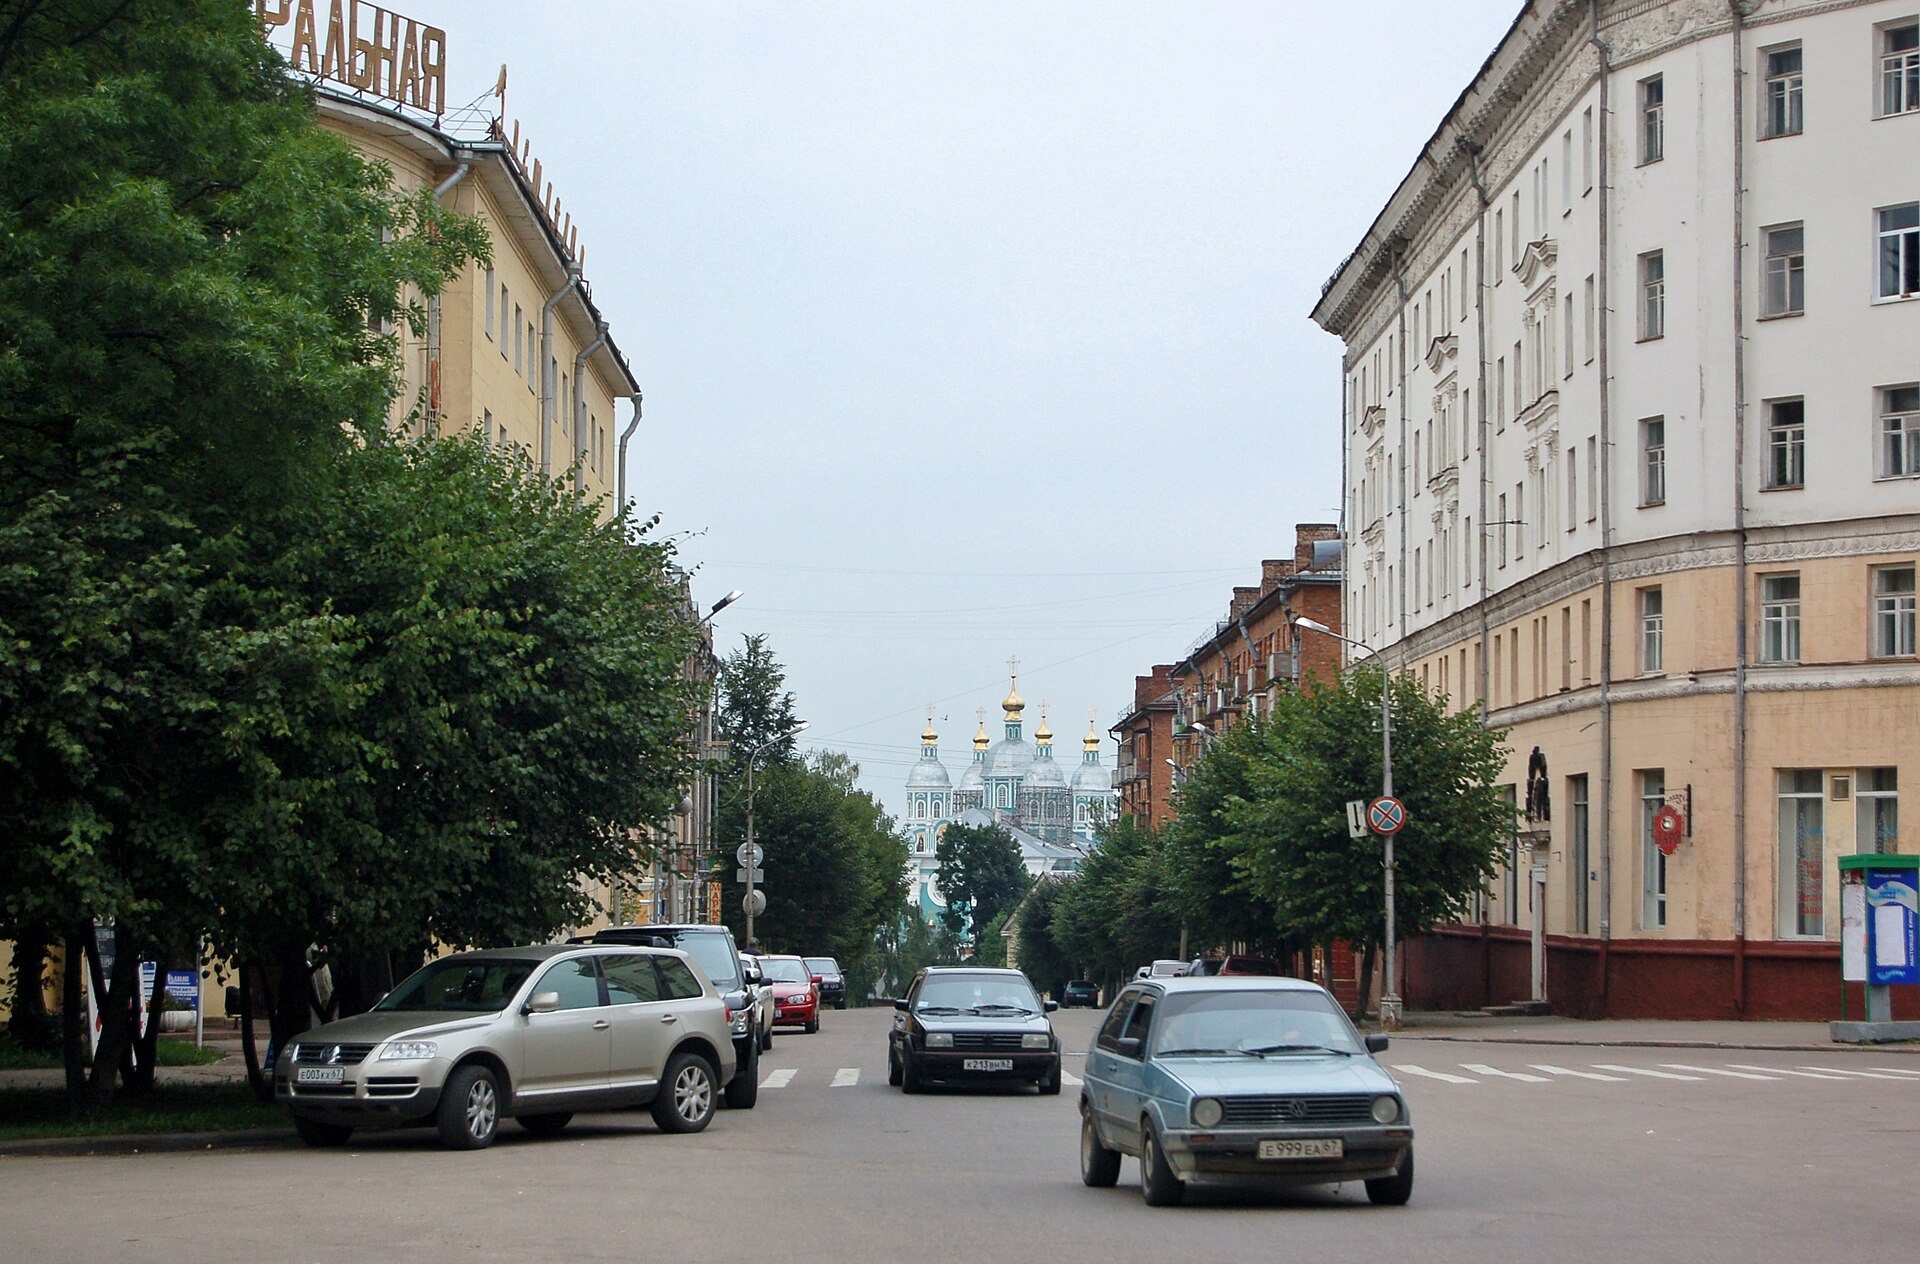
A courtyard — the framework’s point. Trees in a courtyard count differently from trees in a park: different accessibility, different function, and a different fate under redevelopment.
1 / 3Vasily AstaninCC BY-SA 4.0