CONNECTIONMAP
Settlements, gas infrastructure and substations of 35 kV and above across the republics of the former Union. Regions are added one at a time; pick one from the list below the map.
Loading the map…
The question the map exists to answer is simple: where can a connection of 150 kW or more be made or extended, and where is there gas as well. The answer has two halves — infrastructure and free capacity — and they sit in sources of very different quality. Infrastructure is visible in open data, and it is shown here. Free capacity is something grid companies are obliged to disclose, yet none of those checked publishes it in machine-readable form. So the map shows the skeleton and honestly leaves blank what is not yet filled in. The scope is the fifteen republics of the former Union. The map is assembled region by region: each is computed and clipped to its own administrative boundary separately, so the dropdown grows as collection proceeds and the line above the counters says how much of it exists yet.
What is shown and what is not
The same split as elsewhere on this site: on the left what is computed from open sources and can be re-checked by anyone, on the right what an agency holds. Mixing them would cost the reader's trust in both columns.
Shown
Substations of 35 kV and above with coordinates and voltage class — 35, 110, 220, 330, 500 and 750 kV. The 35 kV threshold is not arbitrary: it is exactly the line at which the law obliges disclosure of free capacity.
Gas distribution and regulation stations and trunk pipelines, as mapped in the open dataset.
Every settlement in the region — cities, towns, villages and hamlets, with population where it is recorded.
Not shown
Free transformer capacity at each substation. This is the crucial gap: without it the map shows where infrastructure exists but not where you can actually connect to it.
Whether a settlement is in fact connected to gas, and whether a connection is technically available. The gasification operator knows this; proximity to a pipeline is no substitute.
Live applications and technical conditions already issued — that is, the capacity which is formally free but in practice reserved.
This is why settlements on the map are marked “gas nearby” rather than “connected to gas”. The first is computed and checkable. The second is a fact the operator holds, and substituting distance-to-pipe for it would be passing an estimate off as data.
What this rests on
Disclosure under these rules does happen: every grid company has a portal or an interactive map. But it is published in a form built for a human clicking through a form — no common format, no coordinates, no export. Nobody today, the state included, can assemble a country-scale map out of that.
What to know about the data
The limits are listed here rather than in small print, because a map without stated limits looks more precise than it is.
Substations with no voltage tag were dropped, and there are hundreds of them. Most are 10/0.4 kV transformer substations irrelevant to a 150 kW question, but some of what was dropped may well matter.
The completeness of the gas layer depends on how thoroughly pipelines are mapped in the open dataset, and that varies a great deal. A low count of settlements marked “gas nearby” says more about mapping coverage than about the region's actual gasification.
The data is clipped to the region's administrative boundary, not to a rectangle: the first build caught parts of five neighbouring oblasts and reported 80 % more settlements than actually exist.
Figures from different regions are not comparable with one another. Latvia yields 8,143 settlements — more than almost any Russian oblast, though it is a fraction of their size: in the Baltics the open map records hamlets densely, in Russia it often does not. Within a single region the data is consistent and usable; comparing regions to each other without correcting for mapping coverage is not.
Data source: OpenStreetMap under ODbL. Layers are collected per region and clipped to each region's administrative boundary. Showing:
What a dot on the map stands for
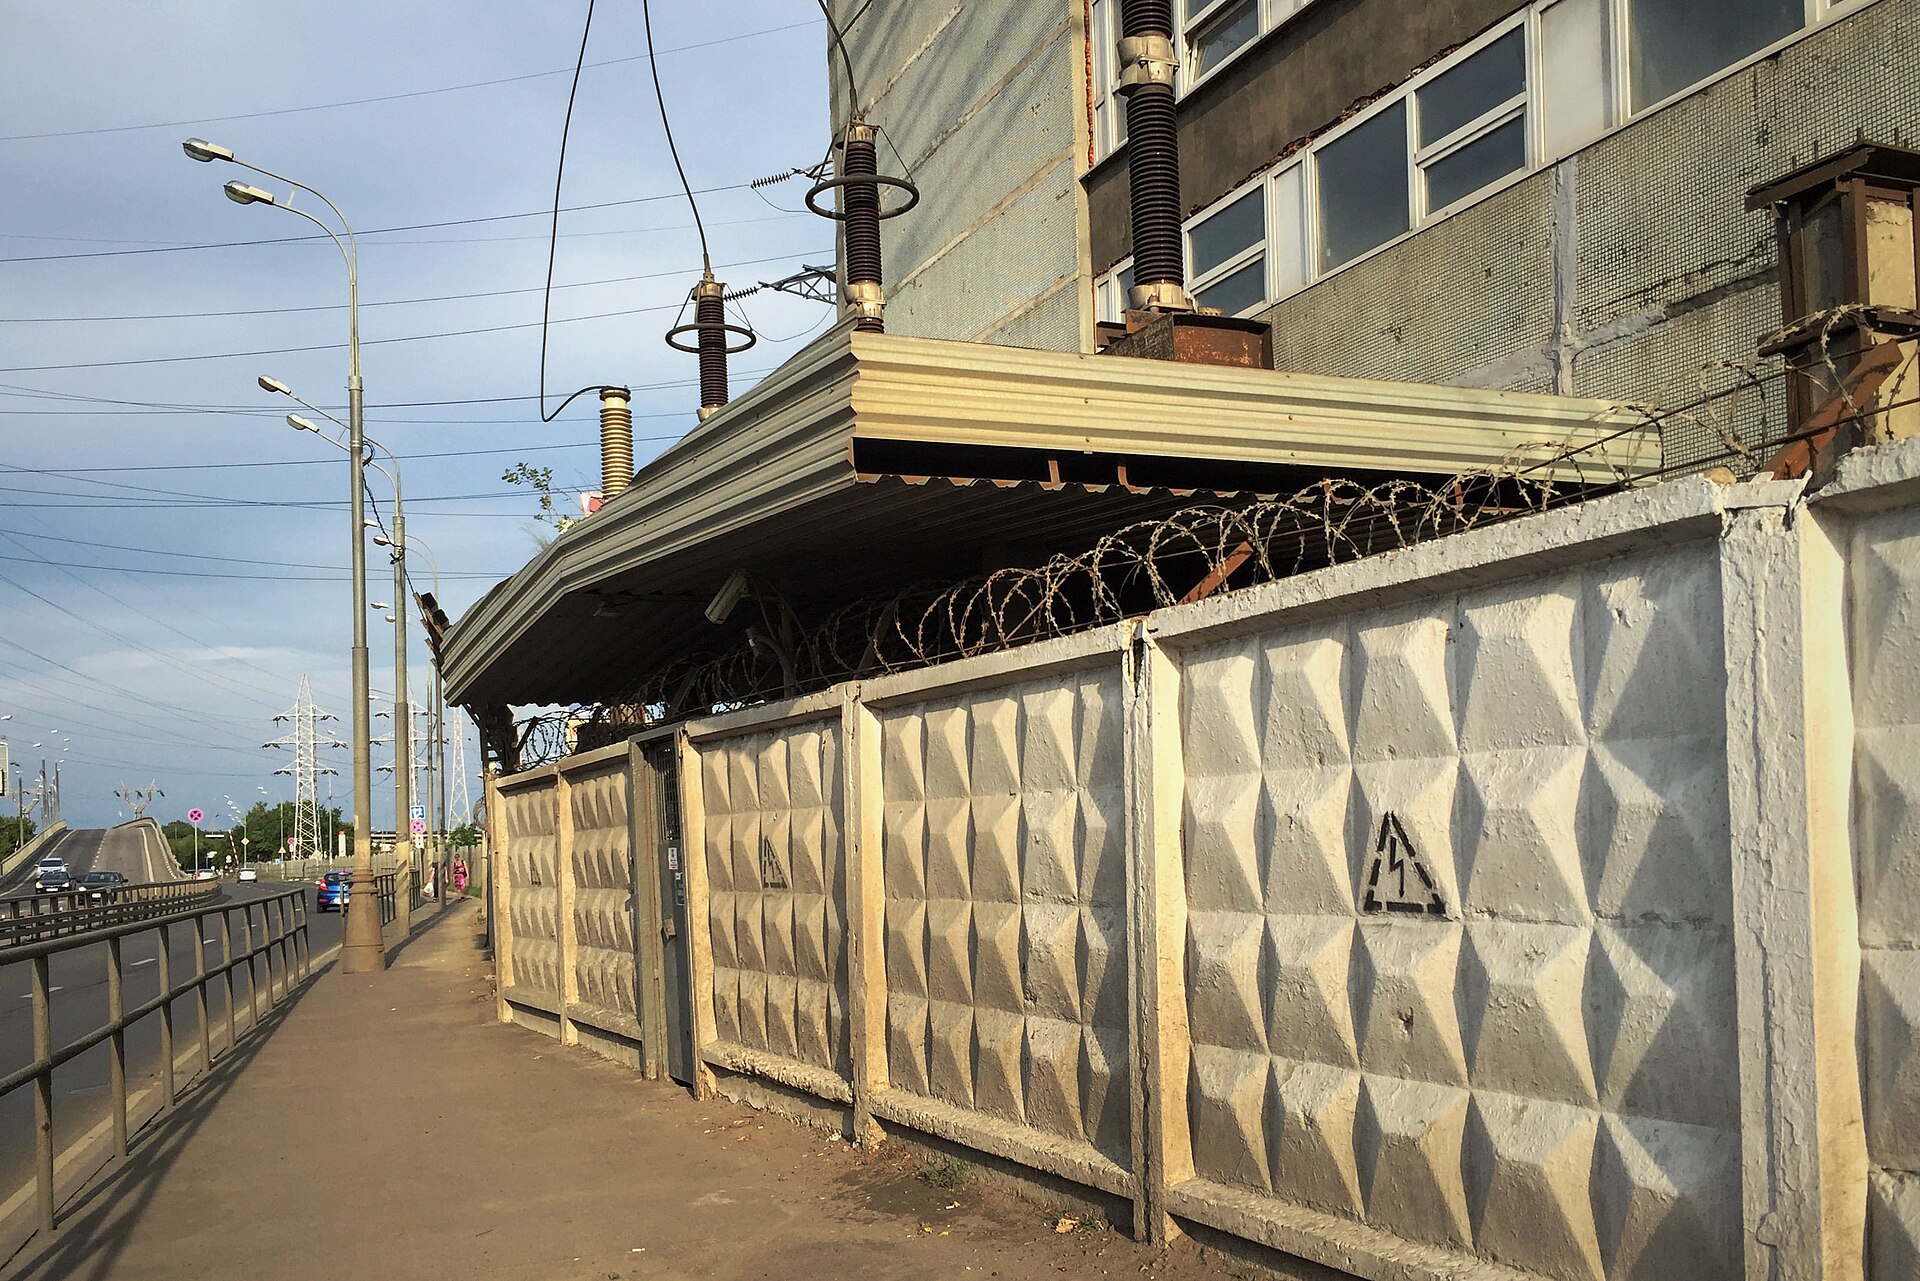
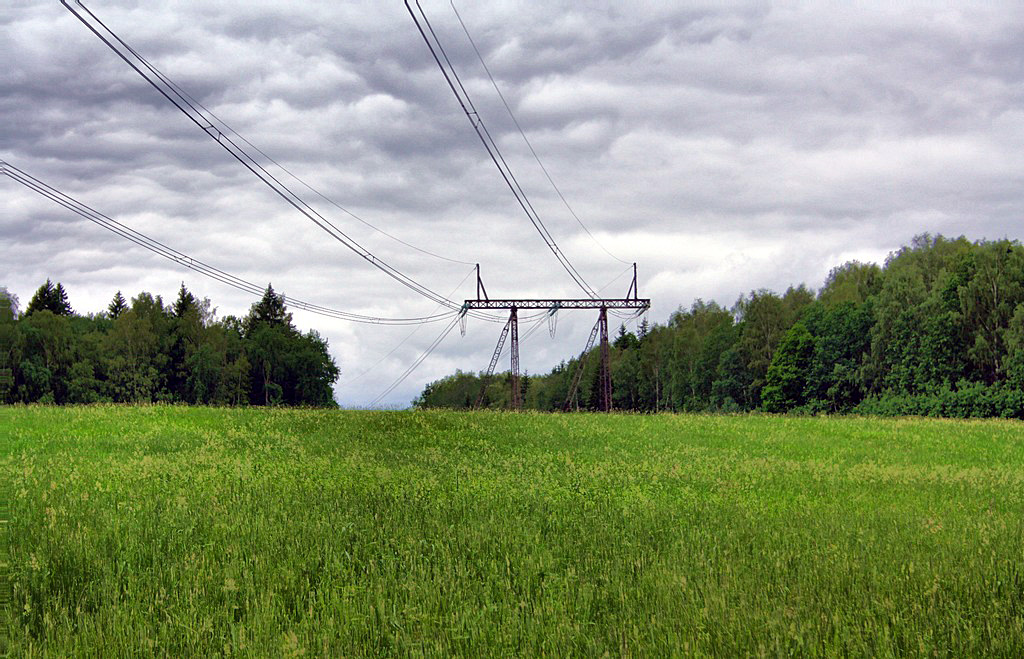
A 220/110/10 kV substation. On the map this is one dot out of 29,861 — and nearly all that open data says about it: where it stands and at what voltage. How much capacity is free is stated nowhere.
1 / 3Gennady GrachevCC BY 2.0